Quantcast
Channel: OpEx Learning Resources
Viewing all 1002 articles
Browse latest View live

Kaizen Training: The Big Picture

$
0
0

kaizen event training, kaizen model

The term “Point Kaizen” or “Kaizen Event” are well-worn statements. We’re familiar with them, as most companies have tried Kaizen or something Lean related at some point in its existence. But, has anybody actually stopped to ask why we use “Point”? or why we use the term “Event”?

Believe it or not, the term “Point” as in “Point Kaizen” has significance.

The term “Point” describes the approach to Kaizen, as well as what might be described as a Lean Maturity. I don’t personally like the term “Lean Maturity”, but its descriptive when taken in context.

Point Kaizen

The term “Point Kaizen” is often associated with discrete events in a department or company. These are continuous improvement activities, where the principles of Lean Manufacturing are applied. “Point” is descriptive because the areas in which Lean is applied are unrelated and discrete. For example, Lean might be applied in the Finance Department as well as in Marketing. But those two Lean Deployments are unrelated with each other.

You might visualize Point Kaizen as the following, taken from Hirano 1.

kaizen event, point kaizen

Line Kaizen

The next step in an organized Lean Deployment is what we know as Line Kaizen. “Line”, within this context, refers to an organized spreading of Lean from Point or Discrete, to the Line. For example, Kaizen might be applied to a process (point), but also to the downstream process. Those two points constitute a Line Kaizen.

An example of this might be found in Lean implemented in Procurement, but also implemented in the Planning Department. In this case, Planning is upstream from Procurement and Kaizen is done at those two points; in which case, this would be a Line.

model line kaizen

Plane Kaizen

The next step in maturity would be connecting several lines together. This we call “Plane Kaizen”. In more modern terms, this might be described as a Value Stream, where instead of traditional departments, the company is organized into product families and value streams.

This might be visualized by diagram below:

kaizen event, plane kaizen

Cube Kaizen

Finally, at least according to this model, we have Cube Kaizen. Cube Kaizen describes the situation where all the points are connected and no point is disjointed from each other. This would be a situation where Lean has spread across the entire enterprise. That picture might look like the image below:

cube kaizen, kaizen event

Below is the model in its entirety:

kaizen event, kaizen training

Additionally, we can take this model and plot it against a maturity curve. As you can see below, many, many companies dabble in Point Kaizen, but as one goes up the maturity continuum, there are fewer and fewer companies as you go from Point Kaizen to Line Kaizen to Plane Kaizen to Cube Kaizen.

lean shingo maturity model

What do you think? Does your experience match what Hirano’s Model describes?

  1. He describes this concept in his book the JIT Implementation Manual

Kaizen Training: The Big Picture is a post from: Lean Six Sigma Consulting


Queueing as Marketing

$
0
0

hate to wait, noah's bagels, queueing, einstein's

That’s right – Queueing as Marketing. In other words, create a service or product around the fact that people don’t like to wait – AND – charge a premium for the service or product. I’m calling that Queueing as Marketing.

Almost all of us hate to wait. If any of us had the option to do something other than wait, I bet we’d all take that option.

But, what if a company were to take advantage of this fact – that people or customers don’t like to wait?

Well, we certainly see evidence of this. For example, Disneyland’s Fastpass is one example.

Here’s another example: Noah’s Bagels is using the fact that some customers are in a hurry and would rather not wait in line for a bagel. So, they created a product to cater to that customer need, which they call “Hate to Wait”.

The steps to the Hate to Wait process are:

  1. Grab ‘N’ Go Bagel Bucket
  2. Proceed directly to cashier
  3. And go

noah's bagels, hate to wait

They like the idea so much that Noah’s Bagels and Einstein Bagels even trademarked the term “Hate to Wait”.

Here’s the legal filing for the trademark “Hate to Wait”:

On Wednesday, December 13, 2000, a U.S. federal trademark registration was filed for HATE TO WAIT? by Einstein and Noah Corp., Lakewood, CO 80228. The USPTO has given the HATE TO WAIT? trademark serial number of 76180171. The current federal status of this trademark filing is SECTION 8 & 15-ACCEPTED AND ACKNOWLEDGED. The correspondent listed for HATE TO WAIT? is Leslie P. Kramer of Faegre & Benson LLP, 3200 Wells Fargo Center, 1700 Lincoln Street Denver CO 80203-4532 . The HATE TO WAIT? trademark is filed in the category of Staple Food Products . The description provided to the USPTO for HATE TO WAIT? is Bagels, bagel chips, bread, sandwiches, pasta salad and bakery goods.

Queueing as Marketing is a post from: Lean Six Sigma Consulting

Visual Management: The Buddy Wheel

$
0
0

buddy wheel, visual management, school art

As most of you know, I have a pretty big family. I’m grateful for my family and I love all the kids – but sometimes, okay more often than not – things are a bit crazy. So, we need all the help we can get in running this massive operation I call my family.

That brings us to the Buddy Wheel.

What is The Buddy Wheel

It’s simple really. The Buddy Wheel is an easy way, that takes advantage of Visual Management Principles, to manage resources and responsibilities: People and Time. Another aspect in managing people and time is the aspect of who and when – because here we’re talking about essentially a round robin of people.

For our family, The Buddy Wheel is a way to do the following:

  • Each child looks out for another child
  • Each child is being looked out for

In our case, “looks out for” means several things. If your buddy is a smaller child, then that might mean that the buddy reminds the younger sibling to brush teeth and change their underwear. If a older sibling is buddies with another older sibling, then the buddy might choose to do secret service, such as making the person’s bed or doing something nice for him or her.

True, they’re one and the same, but creating and formalizing this combinatorial symmetric relationship was the challenge (I made up the word, I’m pretty sure).

How To Create a Buddy Wheel

Step 1

Go to Excel, and create a pie chart. For my family, I created a pie chart with 10 slices because there are 10 people on the wheel.

Note: we have 9 kids. But, I added my wife’s face so that she has a buddy. Why? Well, she broke her foot two weeks ago and her buddy will help her while she’s hobbling around the house.

Step 2

Then, create the outer wheel by cutting out a cardboard larger than the pic chart and continue the pic cuts across the larger wheel.

Step 3

Print 2 faces of each of your family members and glue one face on the inner wheel and the same face on the larger wheel. Make sure the faces line up.

For example, in my Buddy Wheel, the face on the outside wheel takes care of the face on the inside wheel. So, in this case, my daughter Savanah watches out for Kameron and Kameron watches out for Preston.

Step 4

Make a hole in the middle and insert a brad so the wheel can actually turn. Then you’re done.

Visual Management: The Buddy Wheel is a post from: Lean Six Sigma Consulting

Lean Thinking and Emotion: Customer Experience is the Link

$
0
0

customer experience and the emotion, lean, six sigma

In Lean Thinking, traditionally not much has been said regarding the customer’s emotions; except for a bit here around “Voice of the Customer” and a bit there on “Customer Satisfaction”. Other than that, not much else regarding emotion is mentioned.

This is unfortunate because, at bottom, if we are to improve how business is done, we must pay attention to the process and the feelings of the customers that interact with those processes. Doing so gives practitioners of continuous improvement a broader picture of how customers are feeling, as well as the steps they are doing when engaged in a process.
Hard Nosed Science

Lean Thinking is typically focused on measures such as volume, productivity, costs, lead time, cycle time, wait time, variation, defects, warranty claims, customer contacts, and the like. But, behind many of these metrics are customers – people that have feelings and experience a process in a qualitative way.

For example, one might be interested in reducing wait time in an emergency room setting. The typical approach is to identify all the process steps, which ones are value-add and not-value-add, then eliminate the non-value-added steps. Perhaps there might even be a capacity analysis done, balancing the incoming patient volume with the capacity to care for those patients. Maybe, there might even be some work around identifying demand and balancing the pace of care to Takt. All typical approaches from a Lean practitioner.

And, the approach works.

But, do you notice anything missing?

There’s typically no regard for the feelings and the high and low emotions of the customer. In this case the patient. Instead, we get a very mechanical approach to improving the process.

Granted, the process works. But, it’s somewhat nearsighted in its approach.

Why Should We Care About Emotions

Yes, what might seem so obvious still has to be asked. Why? Because in practice, there’s very little attention paid to the feelings of the customer.

So, why should we care about the emotions of the customer? Here are a few reasons:

  1. “Customer Satisfaction”, as a metric, is an emotional one. “Satisfaction” is a judgment that a customer makes and that judgment is based on a feeling, memory, or an emotion. It is almost never mechanical in its nature, and is almost always qualitative.
  2. Emotions can cloud the facts. For example, suppose a highly efficient process, where minimal effort is made by the customer to achieve a desired outcome. Most Lean practitioners would be happy with that. But, suppose that the customer was treated poorly during her interaction in a process that is otherwise highly efficient. What will the customer remember? Will the customer reflect – “wow, that was an efficient process” or “the process was efficient, but they made me feel bad.” The net result of this experience is a bad one and, while the process was optimized, the qualitative experience of the customer was poor. Emotion will always rule Logic.

Here’s a picture of what I’m trying to describe:

lean and the customer experience, the role of emotion

In the picture above, there is often a linear relationship with the number of touches or process steps, with what Lean practitioners would consider value add or waste. Generally, the more process steps, the more waste a process has.

But, that’s not always how customers view the world. In fact, the nature of emotions are such that they are high and low and, often times, we don”t know or can point to anything that caused that emotion. In other words, emotion is often not linear.

In fact, the graph to the left could be happening as the same time the graph on the right is happening – one describing how the customer feels, and the other describing the details of the process. Both can be true at the same time.

The Link is Customer Experience

There is definitely a place for emotion in the toolbag of Lean practitioners. The link here is in the Customer Experience. Being able to do the mechanical aspects of continuous improvement coupled with the an understanding of the delicate and often unarticulated qualitative experience can present a very powerful approach to process improvement.

In my next post, I’ll propose a way to include the variable of  the customer emotion and show how it is relevant to practitioners of continuous improvement.

Lean Thinking and Emotion: Customer Experience is the Link is a post from: Lean Six Sigma Consulting

Visualizing the Customer Experience: Customer Journey Map and Continuous Improvement

$
0
0

customer journey map, instructions

In a prior post, I discussed how most Lean practitioners focus primarily on the mechanical aspects of a process and often ignore the emotions of the customer. In other words, one can improve the process, but with complete disregard for the customer’s feelings as they go through the process. To be fair, they can be mutually exclusive. Therein lies the opportunity.

In this post, I’ll explain (1) What is a Customer Journey Map, (2) it’s role in continuous improvement, (3) show several examples of customer journey maps, and (4) provide a free customer journey map template that you can download.

What I’m arguing for is the opportunity to add the customer’s emotions in our approach to process improvement. To be clear, the processes and context for which I’m describing is relevant are processes that touch the customer – healthcare delivery, retail, customer service, and likely non-manufacturing processes.

Lean Uses Maps – Many of Them

So, in Lean, there are many maps. We use a Value Stream Map, a Process Map, a Spaghetti Diagram, a Consumption Map. What all of these have in common is that they highlight the process, time, inventory levels, and the actors. And, one key variable they all fail to take into account is the customer’s emotions as the customer walk through the process.

So, what ought we do about it?

Customer Journey Map

Well, a map – of any type – is really just a visualization of several variables. Can’t emotion be another variable? Sure, but it’s much more.

Let’s define a Customer Journey Map:

A Customer Journey Map is a document that visually illustrate customers’ processes, needs, and perceptions throughout their relationships with a company, or service(s).

It is primarily an outside-in approach, taking the journey from the perspective of a customer. This approach is important for a few reasons:

  1. A “normal” map is navel gazing and self-centered, often focusing only on process and other mechanical variables.
  2. Often, customer’s needs are not represented. And, their emotions are often unarticulated in most map models.

How to Create a Customer Journey Map

Here are a few steps that I’ve taken to effectively create an actionable Customer Journey Map.

  1. Identify all the customer touchpoints, actors, and silos. Often, this exercise is called “Touchpoint Inventory”.
  2. Synthesize current thinking from all stakeholders involved in the Customer Journey.
  3. Map the process – but not like a normal map used in continuous improvement. This time, map the process from their perspective. This is an important distinction. Here’s an example of a process step that I’m describing:
    • “Press button” versus “I need to press a button. But which button – the red or green?”
    • Notice the difference? In this type of map, we’re actually highlighting the internal dialogue of the customer, and not just the process steps. This approach is much richer, but also more complicated.
    • Needs, Perceptions, Key Moments of Truth, and Wants must be known by this point in the process.
  4. Create the Customer Journey Map.
  5. Have stakeholders review it and validate or invalidate your initial hypothesis.

Actionable Items from a Customer Journey Map

Since a map is a model of an experience, the end goal of a map is two-fold:

  1. Gain empathy and clarity on exactly what our customers go through when they interact with our service.
  2. Identify key areas where we can improve their experience.

Improving the experience is often almost dictated by their emotions. So, the key is to identify the times when the customer is feeling anxiety, unhappy, frustrated – those are signals where an improvement must be made in order to improve the customer experience.

Customer Journey Map Examples

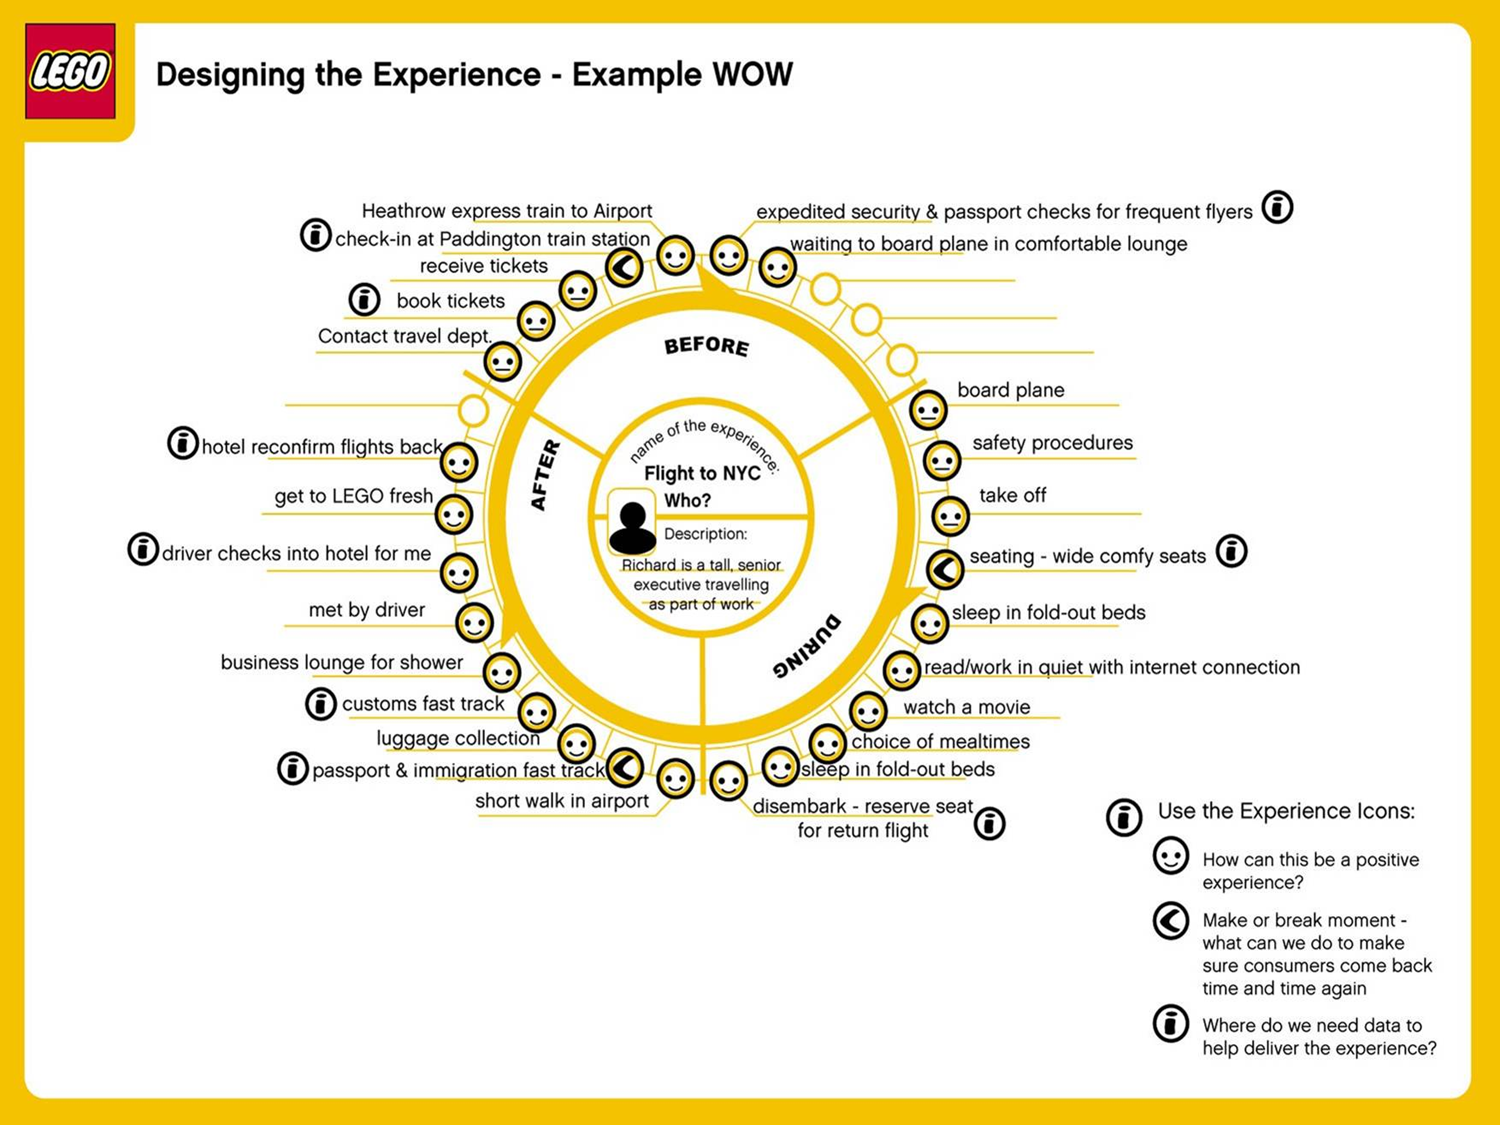
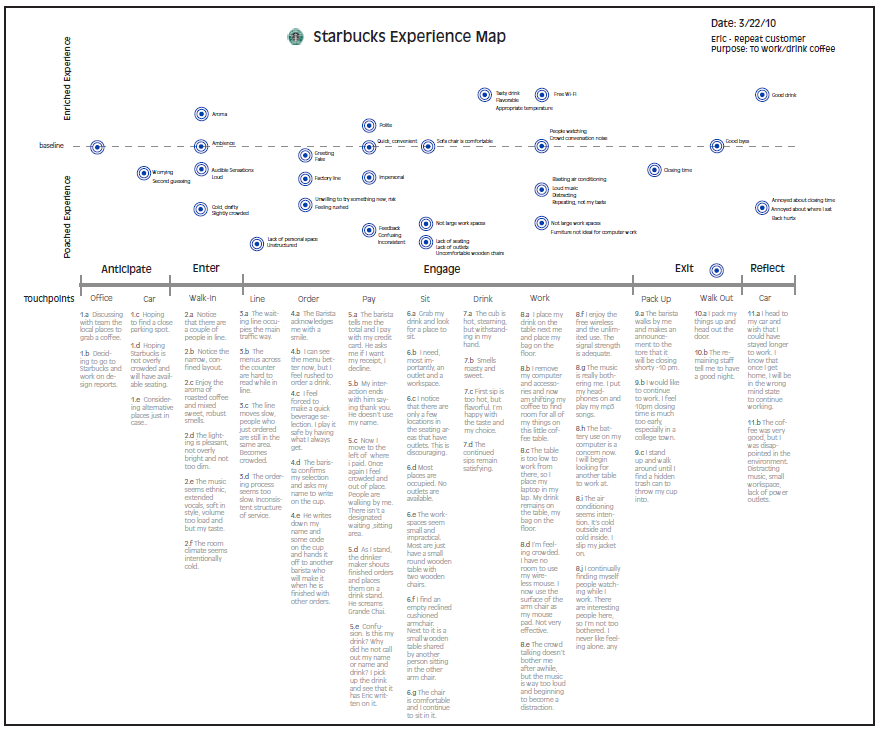
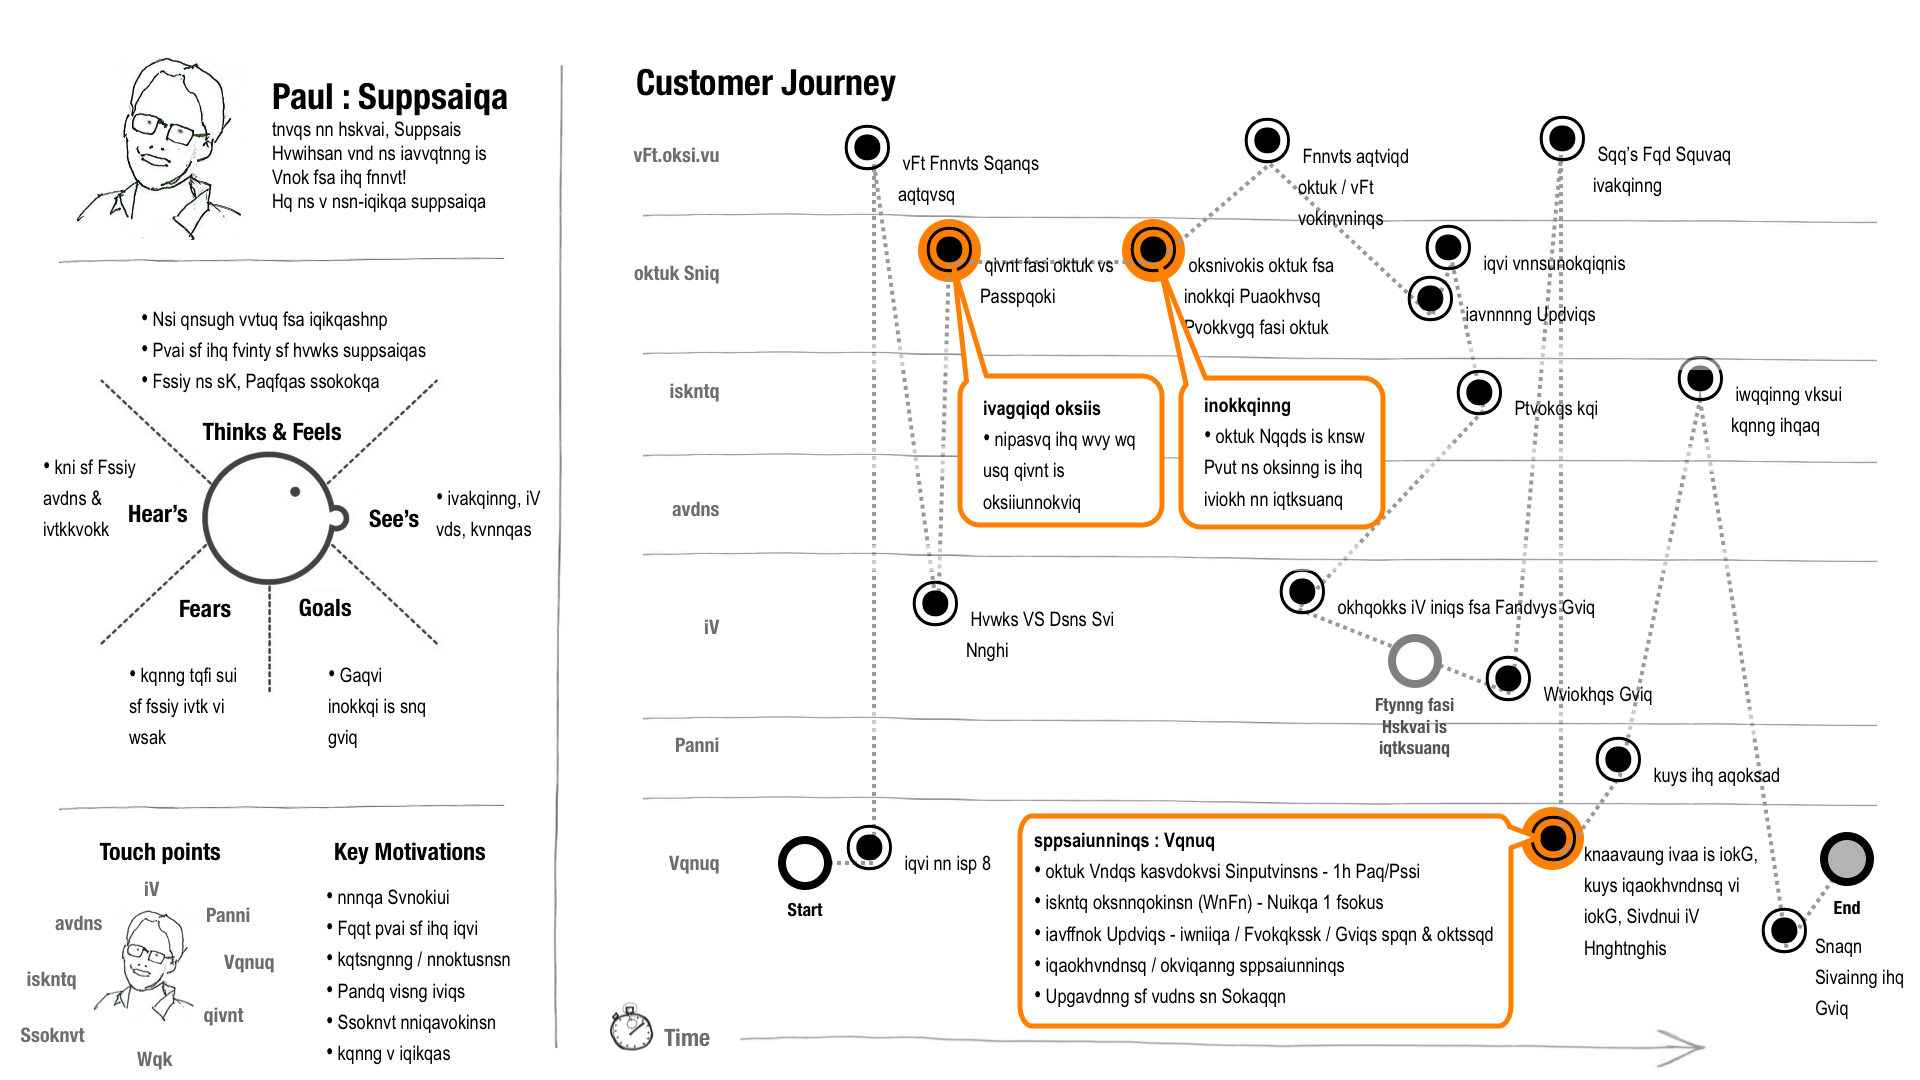
Below are several examples of Customer Journey Maps. Attribution is on the image itself.

Legowheel Experience Map

lego wheel, experience map

Starbucks Experience Map

starbucks customer experience map

Customer Journey Airport Experience

waiting at an airport, customer journey

Customer Journey Map, Service Operation

customer journey map retail service

Zynga, Social Gaming Customer Experience

zynga, social gaming, customer experience

Customer Journey Example, with Emotion

Customer Blueprint, Example

customer blueprint

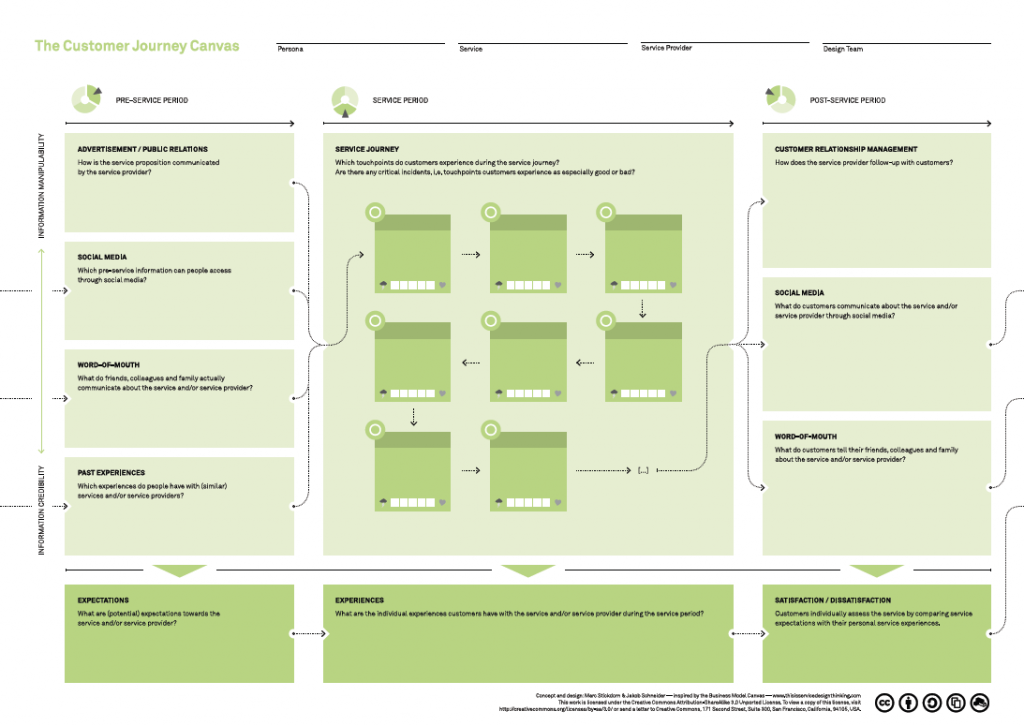
Customer Journey Map Template

Below you can download a Customer Journey Map Template. Give it a shot. See how this tool works for you.

Visualizing the Customer Experience: Customer Journey Map and Continuous Improvement is a post from: Lean Six Sigma Consulting

PDCA Cycle: Lego Style

$
0
0

toyota kata, pdca

It’s not often I see something ingenious. This is one of those times. How about demonstrating the PDCA Cycle via Lego Figures! Håkan takes his approach and applies it to software development, but the same story could be said for any context (except pair programming). Thanks to Håkan for presenting such a great and aesthetically pleasing way of teaching.


Meet the team. This is a cross-functional team, sitting together to solve a problem.

If you’re loving this article, share it on Twitter by clicking here

toyota kata, pdca

They sit together, and there’s a Kanban Board in their work area.

Their Kanban Board shows metrics for Manage for Daily Improvement. It looks like they need to improve on a few things.

They brainstorm together and gather a number of suggestions. But, things aren’t going much of anywhere.

They ask themselves several questions, as described below. They need a more systematic way of improving. A method that is flexible, repeatable, and effective.

Enter, Plan-Do-Check-Act (PDCA).

In general, a Kata is a ritual or an organized behavior. For continuous improvement, there are two types of Kata:

  1. Coaching Kata
  2. Improvement Kata

Coaching Kata has much to do with the Toyota A3 Problem Solving approach.

For this story, we’re going to look at Improvement Kata.

For this, we need to understand Current Condition, identify Target Condition as first steps.

In more detail, we need to

  1. What is the current condition
  2. What is the target condition
  3. Then, apply PDCA to identify the root cause, countermeasures, and then adjust accordingly based on the results.

Here, we work as a team and better organize around PDCA. Currently, we need to understand the general direction, or the context of the problem.

Then, with some data, quantify the problem and articulate the problem in words that someone unfamiliar with the problem space could understand.

You might need to look at and synthesize or analyze data to understand the current condition.

Given the current state, what is the target condition? This requires vision and an understanding of what a defect-free or problem-free process looks like.

The whole middle part between Current Condition and Target Condition is where the bulk of the work will be. This is where Plan-Do-Check-Act will come into play.

In PDCA, we work as a team. We conduct root cause analysis, using the 5 Whys or a Fishbone Diagram, validate the root causes, then brainstorm effective countermeasures that will surgically address the validated root causes.

Here, we do more PDCA.

By working together to systematically solve a problem, we feel more like a team and we create an environment that fosters learning and effective problem solving.

Here, we celebrate.

Thanks to Håkan Forss of the Avega Group.

PDCA Cycle: Lego Style is a post from: Lean Six Sigma Consulting

SWOT Analysis Done Right

$
0
0

swot analysis, fit, matrix

I’ve been in strategy sessions or like meetings where SWOT was done the either:

  1. The question at hand didn’t call for a SWOT. So, in this case, a tool was applied to the wrong problem.
  2. Or, a SWOT was done for the right question, but done very, very poorly or completely wrong.

So, I’m going to stick my neck out and propose my approach to a SWOT Analysis, hoping it might be helpful to somebody.

What is SWOT Analysis?

SWOT stands for Strengths, Weaknesses, Opportunities, and Threats. This approach is used to evaluate the fit between a company’s internal resources and capabilities and external possibilities and threats.

For most companies, it has greater control over its internal environment such as resources, culture, operating system, and people side of things. But, a company has less influence on external factors.

This approach is meant to gauge the fit between the two.

A SWOT is appropriate for the following questions. This is not meant as a manual, but as a general guide.

  1. Given the competitor’s recent release of their product, how might we respond?
  2. What is the current state of our Lean Transformation?
  3. What factors are important to understand in order to more broadly deploy Lean across the company?
  4. Is our team prepared given the current composition and skill set of our team and the challenges ahead?

How to Perform SWOT Analysis?

Step 1

List and evaluate SWOT elements. This can be done using sticky notes or other method. The important thing to do here is to utilize the perceptions of the team and to involve all the right people to participate.

  1. Strengths: A strength is a strength if and only if it is present and meets a critical customer need. The “customer” here is broad and can refer to those outside the company or those within.
  2. Weaknesses: A weakness is a limitation that prevent the company from achieving its objectives.
  3. Opportunities: This relates to any positive or favorable current or future advantage or trend.
  4. Threats: This relates to any unfavorable situation, trend, or change.

Step 2

Unfortunately, most SWOT analysis stop in this next step. What I’m inviting the reader to do is to continue passed this step onto Step 3. But, first, I must describe this step.

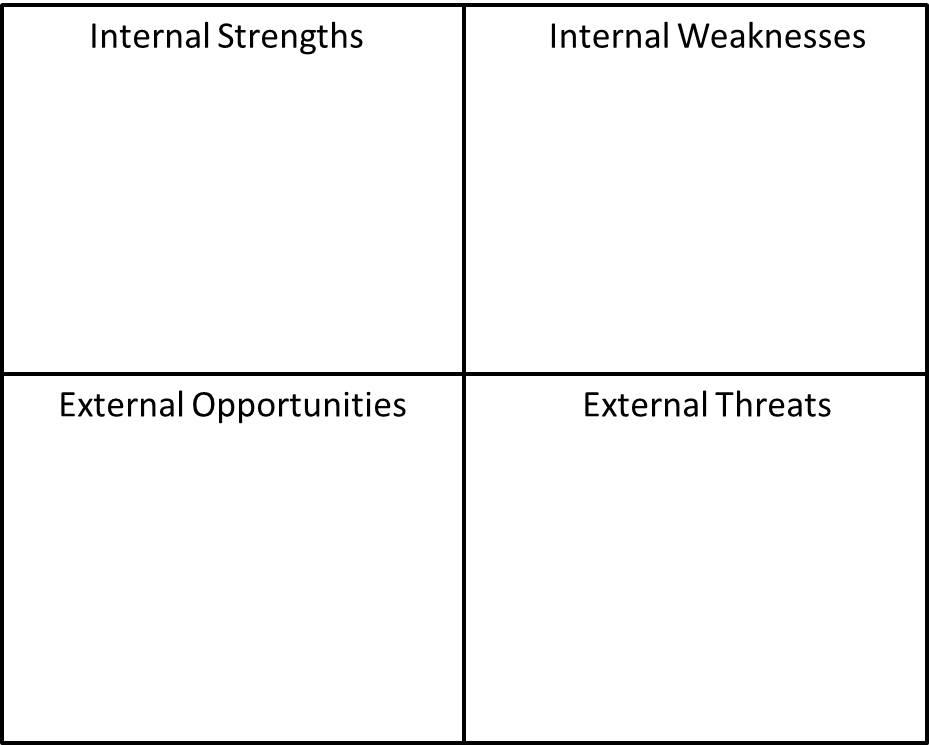
Now, we take the strategic factors identified in Step 1. We take each and then rank them across some criteria relevant to the company or firm. The ranking matrix might look like the below:

Step 3

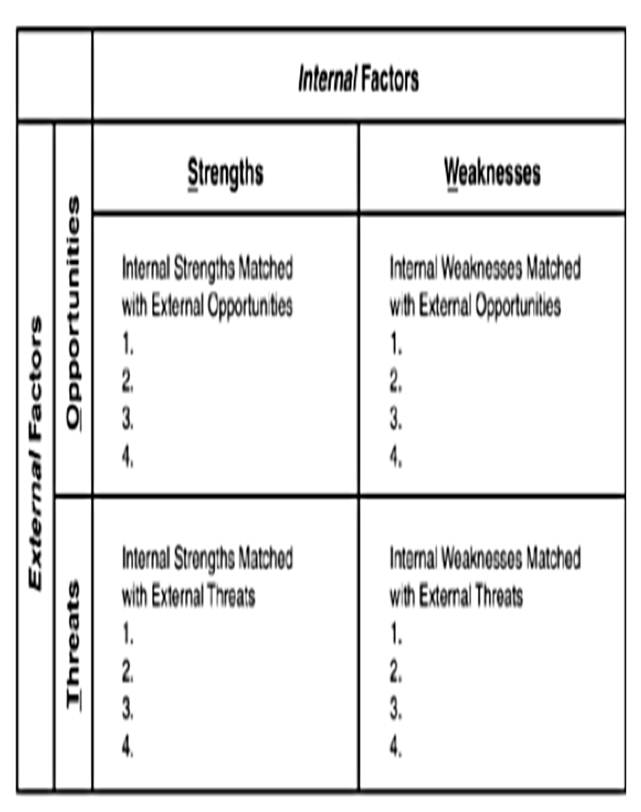
Now, we must match the strategic factors completed in Step 2. This is the section where we satisfy the criteria of “Fit”. This is the section where we turn:

  1. Threats into Opportunities
  2. Weaknesses into Strengths

What I’m describing is pictured below:

After the SWOT Fit Matrix is completed, like the above, then we can dive into what each of the quadrants means.

  1. Quadrant I: In this quadrant, we have matched strategic factors that meet both internal strengths and external opportunities. The strategic factors in this quadrant can drive new business, new products, or new programs within a company.
  2. Quadrant II: In this quadrant, we have matched internal weaknesses relative to external opportunities. The strategic factors in this quadrant can drive where we need to invest or obtain new resources in order to gain competitive advantage.
  3. Quadrant III: In this quadrant, we match internal strengths with external threats. The strategic factors in this quadrant can drive activities that will turn threats into opportunities.
  4. Quadrant IV: In this quadrant, we match internal weakness with external threats. The strategic factors in this quadrant are very important to monitor and be aware of – the firm must be proactive of the strategic factors in this quadrant because, if not, it could very well overtake the companies’ competitive advantage.

In Sum,

SWOT Matrix 
Internal
Strengths Weakness
External Opportunities Strategies that match internal strengths with external opportunities. Strategies that match external opportunities with to minimize internal weakness.
Threats Strategies that maximize internal strength to avoid or capitalize on external threats. Strategies that minimize internal weakness and avoid external threats.

What Not To Do

Here are a few things to keep in mind as you facilitate a SWOT Analysis:

  1. Don’t do long lists of factors. Do, at most, 10.
  2. Make sure the prioritization is done well. This step narrows the possibilities and adds necessary constraints.
  3. Involve the right people – this also means – don’t involve the wrong people.

SWOT Template

Here’s a SWOT Template that you can try out. Good luck.

SWOT Analysis Done Right is a post from: Lean Six Sigma Consulting

Airline Customer Satisfaction: An Oxymoron

$
0
0

jetblue discount tickets

This month, the American Customer Satisfaction Index (ACSI) released their annual customer satisfaction scores for the airline industry 1 and the airline carriers. To no surprise, the scores were dismal, except for one that stands out. Jetblue Airways.

Now, while it’s great for JetBlue, there are clearly several problems with the ACSI methodology:

  1. The Customer Satisfaction scores are released yearly. This is a problem because, at most, it’s a lagging indicator and a poor diagnostic – that is, the score doesn’t lead to any timely or relevant action or efforts around improvement. In sum, it’s just a score.
  2. Satisfaction, as a measure, is very, very broad. It actually doesn’t tell us much. What, exactly, does “Satisfaction” tell us anyway? Exactly – that’s my point.

Nevertheless, here are the results of the ACSI Customer Satisfaction scores for the Airline Industry, broken down by airline carrier, in a nice little infographic I created for you. Enjoy.


customer satisfaction for airline industry


While the ACSI is not perfect, it does give us some insight into how the consumer perceives the airline carrier. But, in terms of a true and helpful diagnostic, the ACSI isn’t very helpful at all.

  1. the details of the article may be found here http://www.theacsi.org/index.php?option=com_content&view=article&id=213:acsi-scores-june&catid=14&Itemid=262

Airline Customer Satisfaction: An Oxymoron is a post from: Lean Six Sigma Consulting


NPS Customer Feedback Loop, Closed Loop System, and Lean Thinking

$
0
0

nps customer feedback loop, example, model

The Net Promoter Score (NPS) is a metric that more and more companies are using as a measure of loyalty and, proponents argue, is a leading indicator of future profit and earnings. One of the critical components that many companies miss and fail to implement is the closed-loop customer feedback system that makes customer insights into actionable improvements.

In what follows, I’ll share my experience of how I’ve been able to blend Lean Thinking (or just plain continuous improvement) with NPS.

Customer Feedback Loop

Below is the high level Customer Closed-loop Feedback System I’ve designed and used at several companies:

If you’re loving this article, share it on Twitter by clicking here

If you’re looking at it and wondering to yourself “Hmmm, man, that looks a lot like the Toyota A3 approach or PDCA“, then you’d be right. That’s exactly what that is, with a few minor changes that I’ll describe below.

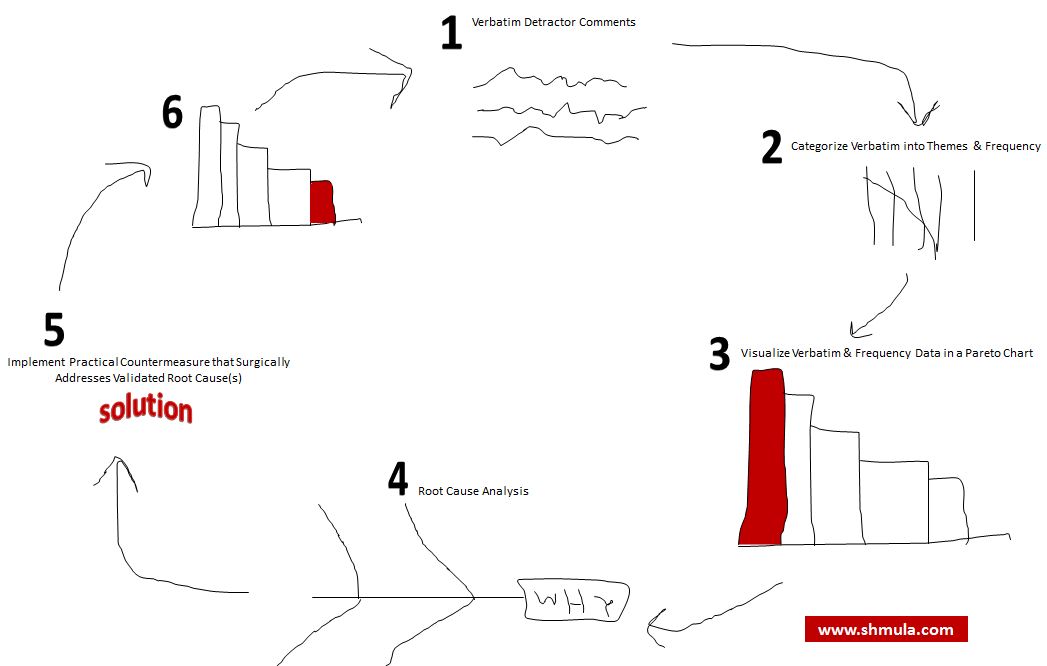
Step 1: Collect Customer Verbatim Comments

This is the step where verbatim comments from Detractors, Promoters, and Neutral survey respondents are collected. In this step, we’re primarily interested in the Detractor verbatim comments.

Step 2: Categorize Verbatim Comments into Themes & Frequency

"What is the Deming Cycle?"
The Deming Cycle is best known by the acronym PDCA. Learn more about it from a fun LEGO Model
 In this step, we want to categorize the detractor comments into major themes. Then, we use basic tick sheet methodology to start ranking each theme by frequency to ascertain the gravity of the customer complaint.

In this step, we need to satisfy the MECE Principle: Mutually Exclusive and Comprehensively Exhaustive. This means that if I tick x in one category, I cannot also tick x into another category.

Step 3: Visualize Data in a Pareto Chart

To make sense of the data, it must point us somewhere that is both directionally correct and actionable. One effective way to do that is to visualize the data in a Pareto Chart. Using the Pareto Principle, we hope to find the 80/20, in order to better align and mobilize our scarce resources as well as attack the 20% of the problems affecting 80% of our customers.

Step 4: Apply Root Cause Analysis

Once our Pareto is reasonably sufficient, we must then attack the first few bars in that Pareto. The next step is to do the 5 Whys or a more thorough root cause analysis. This step might even include Hypothesis Testing, if necessary in order to validate or invalidate our hypothesis.

Step 5: Implement Practical and Simple Countermeasures

Once hypotheses have been validated, then it’s important that we implement simple and effective countermeasures. This step must be done quickly and not get caught up in red tape or corporate bureacracy or else the defect will continue to negatively impact the customer, of which  internal strife and internal infighting will be the cause. Get it done quickly, but apply effective and simple countermeasures that surgically attack the root cause(s).

Step 6: Measure and Adjust

In order to learn and to improve, we must measure our efforts in order to gauge whether we actually improved the customer experience by reducing the defects they have shared with us. Ideally in this step, if we did things correctly, by effectively attacking the largest bar in the Pareto in a previous step, that bar which was the largest representation of a customer complaint should now be the smallest. This would represent success on behalf of the customer.

NPS Customer Feedback Loop, Closed Loop System, and Lean Thinking is a post from: Lean Six Sigma Consulting

Macaroni Grill: Ordered Chicken but Got Beef and the Net Promoter Score Survey

$
0
0

restaurant management, macaroni grill

A few weekends ago, my wife and I went to Macaroni Grill for dinner. We had a great server who was funny, helpful, and courteous. After looking at the menu, I decided to order a meal with Chicken – some new summer entree and I don’t remember its name well. But, I was looking forward to trying something new.

Boy, did I get something new and surprising.

Raw Beef or Cooked Chicken?

We finally got our food and in the course of eating, I took a bite of what I thought was a mushroom. But, it turned out to be mostly raw beef. Here’s the picture below:

macaroni grill entree

Getting Beef when I was expecting Chicken was one surprise. But, receiving raw beef was not good because it is a safety issue and is also pretty disgusting.

We told the server, and instead of not charging me for my meal, she gave me and my wife desert for free. All in all, the desert cost $7.00 – which was nice, but not quite correcting the raw beef experience. I didn’t fight it because the server was very nice and we courteously said “thanks”, paid, and then left. But, we didn’t leave with the best of memories or experience.

In the following pages, you’ll see what I mean.

Macaroni Grill: Ordered Chicken but Got Beef and the Net Promoter Score Survey is a post from: Lean Six Sigma Consulting

[Guest Post] An Outsiders View of Agile Software Development: Part 1

$
0
0

daily agile, scrum

We’re pleased to welcome Joe Woods as a guest post today, who will be sharing his thoughts with us on what he likes about Agile Software Development, Part 1. In Part 2, he’ll share with us his thoughts on what he doesn’t like about Agile Software Development.

The Agile movement in software development is heavily influenced by Lean and the Toyota Production System – often times called Lean for Software. As you read this – especially if you’re not a software guy – be careful to look for applications of Lean in how software is developed.

Enjoy the post.


This is my view of the agile software development process from an outsider’s perspective.  Now I’m no agile expert, far from it actually.  I was always told that we’re an agile shop or that we use waterfall (cringe). Ok, that’s fair enough.  All that meant to me was that we do releases every couple weeks or weekly and I have to go to a bunch of team meetings.  I also would have to write these things called stories and they couldn’t be too broad and being too narrow meant I missed some functionality.  It always seems to be the case that the last place I worked did it wrong, so I always had to learn another way to write a story, how to assign points, and what I had to do to accept or reject a story. Not a big deal once you learn what’s expected.

Now, I’ve been in the internet marketing space for about 10 years now and have had the opportunity to work for many different companies from small start-ups to Fortune 100’s.  I’ve had to wear many different hats in this time.  Sometimes I was the marketing jack-of-all trades, other times I was the SEO guy, and more recently the consultant/project manager/product manager, slash this or that.  Basically, I’ve always been a stakeholder in agile terms.  I’ve worked in agile shops, waterfall shops and shops where there is no process.  My job success has always been measured by how far I can take the business from points A, B, C and D.  It’s vitally important that I get some quick wins starting out to prove my worth and then continue to move the ball or move the needle or get to the next level. Speed and buy-in are always a factor, results are a must, and time is of the essence.

Waterfall versus Agile

Working in a waterfall shop usually meant that I had to spell out all requirements for a typical request, bug, or functionality in great detail.  All requirements had to be included and every detail accounted for.  I find breaking it down to a very basic level seems to work best here without insulting anyone.  Drawing a picture and placing arrows seem to work best to get the point across.  Then everything had to go through a vetting process and get signed off multiple times.  Waterfall releases were always planned months in advance and pretty much set in stone.  This meant that if I started with a company right at the beginning of the new cycle, which always seemed to be the case, then I had months of waiting to get anything done.  Even the simplest change took an act of God to make happen, if it were to happen mid-cycle or in the next release.  Well, that’s never a good thing as mentioned above and I always knew it was a matter of time before I was gone.  Later, I would watch my requests get worked in and the site become successful as a result.  This is more of an issue with impatient management and managing expectations on my part than the process itself, but I think it points out the inefficiencies with Waterfall project management.

Fast forward to agile development success.  I have to say that I really like agile much better.  The reason I like it better is simple: speed.  We have more releases which mean I can effect marketing changes and web changes much faster.  Sprints can be planned out months in advance as well, but most times they are only planned a release or two ahead.  There is also some flexibility in adding additional stories to the queue.  So for me, getting a couple stories placed in a sprint or added if the points are available is always a good thing.  Marketing things get done faster, numbers come in faster and everyone is happy.  More importantly, I get to keep my job.  However, agile isn’t without its quirks either.


About Joe Woods

Joe Woods is one of the top SEO and Internet Marketing Specialists in the Southeast US and has worked with Agile and Scrum since 2007. Joe currently works with Version One and many of the industry’s leading Agile coaches to help IT teams and practitioners evangelize the many different process from Agile, Scrum, XP and Kanban.

[Guest Post] An Outsiders View of Agile Software Development: Part 1 is a post from: Lean Six Sigma Consulting

[Guest Post] An Outsiders View of Agile Software Development: Part 2

$
0
0

visual management, kanban for software

This is Part 2 on Joe Woods’ views on Agile Software Development. He shared with us his initial thoughts on the subject in Part of Agile Software Development – what he likes about Agile Software Development. In today’s post, he shares with us a few things he doesn’t like about Agile, sometimes compared to Lean for Software or Kanban Software Development.

Enjoy the post.


This is my view of the agile software development process from an outsider’s perspective.  Here’s what I don’t like about Agile or what seem to be the most common issues:

1. You’re Doing it Wrong

What I don’t like about agile, now this is just my experience, is that it seems very rigid in many ways.  I think too many developers and project managers are way too strict on the process piece.  It has to be by the book or it’s wrong and must be done over.  Every place seems to do it differently and no one seems to do it the “right” way according to the developers or project managers.  I’m not talking about a couple of instances, I’m referring to most places where I’ve worked that use agile.  Am I wrong in thinking that agile was created to be adaptive to whatever environment where it’s used?  I don’t think there is one right way of doing it, just some basic guidelines and see what works for you.

2. Wording the Story

Too many team leaders are quick to throw something out because the story wasn’t written a certain way or the story is too long.  Maybe this is a control issue, but it seems to irk some people when things aren’t worded a certain way.  Usually when this happens, I have to rewrite the story or break it out.  Ok, no problem, but let’s try to be “agile” about this and cut a stakeholder some slack.  Developers don’t like the dreaded ‘R’ word (rework) and as a stakeholder, I don’t like having to rewrite things if you can understand what I’m requesting.  The process isn’t going to break if the story isn’t worded a certain way.

3. Meetings, Meetings and More Meetings

The other issue for me is there are way too many meetings that have to take place.  Take for example one company I worked at had 3 development teams, 10 developers per team, with one dev team per division.  I was a stakeholder in all 3 teams which meant that I had to go to 3 stand-ups every morning, 3 estimation sessions, 3 sprint planning meetings every other week, 3 release meetings, and 3 post release meetings.  If I didn’t go to these, then I wasn’t viewed as a team player or supporting the process.  That’s a lot of meetings and time considering my job isn’t a project manager for each, but a stakeholder in all.  Now I know this is just one company and does not represent all agile shops, but there are a lot of meetings either way.  Keep in mind as a stakeholder; I also have reports to create, other meetings to attend and I still have to deal with other departments.  Not to mention doing my own job. Let’s try to cut down on the meetings or get the stakeholders out fast especially if they only have 1 or 2 stories in the sprint.

My Conclusions about Agile

What I like about agile is the speed and flexibility to get things done.  The process used in the development does matter and can mean the difference between success and failure or in my case job or no job.  There seem to be common issues at every place I go.  No one seems to do agile right, their words not mine.  Writing an agile story varies in different shops, who does the QA is different and who accepts the stories is always completely different.  It seems to be a process within a process and learning the nuances is important to get along with the team.  Meetings are important, but seem to be overbearing in a lot of ways.  Let’s streamline that process if we can and reduce the number of meetings.  Overall, I still like agile and there is more sense of a team environment.  I can say I owe a lot of my successes to the agile process and I can live with the quirks.  From an outsider looking in, it’s not a perfect process, but I think it’s a must have to be innovative and successful in the fast paced internet marketing space.


About Joe Woods

Joe Woods is one of the top SEO and Internet Marketing Specialists in the Southeast US and has worked with Agile and Scrum since 2007. Joe currently works with Version One and many of the industry’s leading Agile coaches to help IT teams and practitioners evangelize the many different process from Agile, Scrum, XP and Kanban.

[Guest Post] An Outsiders View of Agile Software Development: Part 2 is a post from: Lean Six Sigma Consulting

[Guest Post] 3D Printing and Reducing Product Development Costs in Your Supply Chain

$
0
0

3d printing examples, companies, services

We’re pleased to have Farrah Pappa present a guest article today on her thoughts on 3D Printing, Lean Manufacturing, Reducing Product Development Costs, and how 3D Printing can help improve the overall Supply Chain by reducing waste.

Read more about Farrah after the article and enjoy.


3D Printing is no longer a fantasy of the future for small business. It does not require your company to invest in 3D glasses – BUT it will allow you to prototype your products at a lower cost in the convenience of your office.  Gone are the days that 3D printers were considered an expensive investment reserved only for large corporations. Now 3D printers are affordable and can help your company reduce the waste they produce.

3D printing, also known as additive manufacturing, is a process of making 3D solid objects from a digital file. An object is created by laying down successive layers of resin material. This type of printing is unique in comparison to traditional machining techniques which mostly rely on the removal of material by drilling and cutting.

Many industries have begun to implement this technology to improve their productivity and product quality with these miniature models of their products.  Fields like jewelry, industrial design, architecture, construction, automotive, aerospace, dental/medical industries, education, geographic information systems and civil engineering all employ this technology.

Traditionally businesses would send their prototype designs to a 3rd party company to create and send back to them. This introduced long lead times, delayed production and a hefty bill for many companies. The costs of prototyping your products can range from $500 to $15,000. The costs can vary greatly depending on your situation.  If you employ a 3rd party to design your prototype themselves then create it – your bill will naturally be higher than if you are sending them your design to simply create. The cost can also range based on the size of your prototype.

The most affordable 3D printers on the market range from $600 to $1,800. This is significantly lower than employing a 3rd party vendor. When 3D printing first surfaced the average printer averaged $50,000. Recently the cost of 3D printers has gone down and allowed businesses of all sizes to utilize this new innovative technology.  Check out this article for more information on the various 3D printer options, including videos.

Increase productivity by being able to prototype your own designs in house without having to pay a 3rd party. Reduce the amount of times you send your prototype through the approval process, and the time you wait for it to return from the lab. Once your company has acclimated to the 3D printer functionality you’ll observe a reduction in the amount of prototypes created for each product. This technology also offers an opportunity for your company to improve product quality. Make quick changes to your product’s prototype in house without causing any delays in production.

3D printing can also reduce labor and time waste. Employ the creative talents of your staff when designing your prototypes instead of outsourcing. They know the purpose of the product and the target audience the best – their ideas would triumph a 3rd party. Eliminate the time you waste waiting for your prototype to return from the lab and jumpstart production.

Take a look at this table to get a clear understanding of what 3D Printing will deliver for your company.

3D Printing and Waste in Supply Chain

Type of Waste Manufacturing Examples of Waste
Motion Companies don’t employ the creative talents of their staff and instead outsource 3rd party companies to design and create their prototypes.
Inventory A prototype can’t be created until the design is approved by the different people apart of the approval process. This wastes time and could potentially delay production.
Waiting Companies sometimes have to wait 5 to 10 business days to have their prototypes delivered to them.
Over Processing Changes made to prototype designs have to be resent to the lab which increases your waiting time and the size of your bill.

About Farrah Pappa

Farrah Pappa is a content editor for SupplyTimes.com, providing helpful resources and information on supply chains, logistics and more. She has a degree in Journalism from the University of Missouri and writes on a variety of topics, usually focusing on B2B businesses.

[Guest Post] 3D Printing and Reducing Product Development Costs in Your Supply Chain is a post from: Lean Six Sigma Consulting

[Guest Post] How Detailed Should User Stories be in Agile Software Development?

$
0
0

user agile stories, kanban software development

Today we are pleased to welcome Ed Hill, who is providing a guest post for Shmula.com today, where he discusses Agile User Stories and explains, in practice, how detailed they should be.

For Lean folks, an Agile User Story is akin to a piece or a part in manufacturing. In software development, rather than dealing with pieces or parts, we’re dealing more with software features and functionality. But, the principle here is about “How large should the batch size be?”. Does this ring familiar with Lean practitioners? Yes, the principle here is single-piece flow, but with application for software development.

Read more about Ed after the article.


How Detailed Should Tasks be in an Agile Story?

When I first started using agile project management, my stories didn’t have enough detail. In my office we use Agile to manage our marketing department with 2 week iterations. Even from the beginning, I could see the value of bite size goals that you could accomplish in a short time span. Agile project management is effective in managing our marketing work, even though it was originally created to manage software development projects. It helps our self-managing marketing team to specifically define marketing projects, while limiting the scope of each project to what can be accomplished in a day or two. This whole agile approach is faster in producing results and adapts rapidly to changing customer needs.

agile user storiesWhen I first worked with marketing stories, I was content to put 1 or 2 tasks into the each marketing story and then start the work. Unfortunately, without a clear definition of done and well defined tasks, I often suffered from scope creep. Simple stories became longer and more complex. Over time I’ve learned to add just enough well defined tasks to accurately drive each project to a timely finish.

How much detail do we need in agile tasks without spending excess time in the planning stage? Let’s take a look at why it’s good to add more detail to tasks in a story. To get a handle on this question, I talked to a developer familiar with breaking agile stories down into tasks.

“I think one of the great uses of tasks is to capture the output of planning each agile story,” says Developer Rajiv Delwadia, of VersionOne. I learned more about the value of planning a story and creating tasks when Rajiv explained planning stories for software development.

“Remember the story, in XP(extreme programming) at least, is a placeholder for a conversation.  When the team estimates each story, and possibly again when a pair picks up a story to work on it, conversation happens between the developers and the customer. During story planning, the developers will think of the things that need to be done in order to implement the story”, explained Rajiv.

If we sum up the benefits that Rajiv is outlining, we see that capturing those as tasks will:

  • Carry the output of that thinking forward
  • Provide a sense of how big the story is
  • Hopefully expose dark corners and edge cases
  • Help define when the story is “done”
  • Make it evident if there are actually multiple stories that can be broken out. Development teams should hone their sensitivity to this.

“Also, don’t forget tests.  Whereas tasks capture what needs to be done, tests capture the details of desired outcome.  Both are important,” said Rajiv.

So how big does a story have to be before it’s too big and really needs to be broken into two stories? Rajiv tells me, “On our team, anything larger than 1 point should be broken down. Our scale of estimates is:”

  • 0.5 = trivial
  • 1 = normal, well-defined, achievable in a day or so
  • 2 = some lack of definition, or not a single cohesive story, or too large for a couple of days
  • 4 = outragous; this is probably an epic

“A story that is already a 1 might call for 15 minutes of planning when a pair picks it up.  Of course, it may have had much conversation leading up to that point.  Likewise, much ongoing conversation will occur before it is closed,” said Rajiv.

I get some valuable concepts about agile from what Rajiv has said. I can also generalize his ideas to any kind of work that’s managed with agile project management. Some of the benefits are;

  • In the iteration planning stage, a story may lack enough detail to estimate the points or time required. Adding smaller tasks, of a known length, can help build a realistic estimate of the hours required for the story.
  • If you’re is not familiar with the solution to a technical issue, then this represents a risk in terms of the time required to solve the problem. Writing tasks with estimated hours for all the known tasks of the story, means that the unknown part of the task is limited.
  • Breaking down the story into tasks forces you to think about how you will approach the story. It also forces you to consider whether testing or revisions are needed before you can take the next step.
  • Planning the tasks to implement a story also allows you to see if someone else in your team can be working on different tasks for the same story in parallel.

When you’re first introduced to Agile stories, you may not see the value of breaking stories down into detailed tasks. When I compare agile project management for software development versus agile for marketing, I see that detailed tasking eliminates a lot of wasted work. As a marketer, I see that being specific about the definition of done and defining the steps I’ll use to get there is a tremendous time saver for me.

If you use agile methods in your work, how much time do you spend on planning stories? Is detailed task planning helpful in your work?


About Ed Hill

Ed Hill is one of the top Marketing Specialists in the Southeast US and has worked with Agile and Scrum since 2009. Ed is a marketing blogger for AgileScout and works with VersionOne to help IT teams and practitioners evangelize the many different forms of Agile, Scrum and Kanban.

[Guest Post] How Detailed Should User Stories be in Agile Software Development? is a post from: Lean Six Sigma Consulting

DMV Queueing Properties: Waiting in Line at the Local Department of Motor Vehicles

$
0
0

dmv practice test, driver's license

No matter who you are – rich, old, poor, young, famous, infamous, or not known to anybody – there are a few things that unite us all and we all have in common:

  1. We all bleed
  2. We all breath oxygen
  3. We all put on our pants one leg at a time
  4. Taxes
  5. AND – we are all subject to government services, such as the DMV.

Thus was my plight a few weeks ago.

Renewing my Drivers License at the DMV

In the United States, every few years you have to renew your Driver’s License at the Department of Motor Vehicles (DMV). So, mine was expired by a few days, I needed to renew it or else I wouldn’t be legally allowed to drive my vehicle.

So, I planned on being at the DMV the second it opened, hoping that things would go quickly and smoothly. I made sure that I brought my Passport, Social Security Card, and 2 proofs of residency for my state, since I moved here out of state.

I arrived at 9:02 AM and there was, unfortunately, a line going out of the building. So, I patiently took my place in the Queue and waited patiently. Even though I had to wait, I received excellent customer service.

dmv online practice test

While waiting in line, I thought to myself that I should collect Queueing data. Heck, I have nothing better to do, so below is the data set I collected.

Cycle # Start Time End Time Service Cycle Time # of Arrivals # of Departures
1 07-26-2012 09:03:54 AM 07-26-2012 09:07:55 AM 240.815754 7 1
2 07-26-2012 09:07:55 AM 07-26-2012 09:09:07 AM 72.783765 1 1
3 07-26-2012 09:09:07 AM 07-26-2012 09:10:41 AM 93.917907 2 1
4 07-26-2012 09:10:41 AM 07-26-2012 09:12:28 AM 106.948664 0 2
5 07-26-2012 09:12:28 AM 07-26-2012 09:14:26 AM 118.004521 0 2
6 07-26-2012 09:14:26 AM 07-26-2012 09:16:24 AM 117.90553 1 4
7 07-26-2012 09:16:24 AM 07-26-2012 09:19:22 AM 177.614429 1 2
8 07-26-2012 09:19:22 AM 07-26-2012 09:25:01 AM 338.985608 1 1
9 07-26-2012 09:27:16 AM 07-26-2012 09:28:35 AM 78.453296 2 1
10 07-26-2012 09:28:35 AM 07-26-2012 09:29:42 AM 67.075174 0 1
11 07-26-2012 09:29:42 AM 07-26-2012 09:34:54 AM 312.357674 6 1
12 07-26-2012 09:34:54 AM 07-26-2012 09:35:31 AM 36.476468 0 2
13 07-26-2012 09:35:31 AM 07-26-2012 09:37:17 AM 106.247341 0 1

Data Definition

To do the above time study of waiting times at the DMV, I just used my iPhone clock and a pencil and paper. Really simple – boring – YES; but simple too.

Here are the definitions of the above data values:

  1. Start Time / End Time: This is the time from when a customer is called to the DMV officer to when the customer is complete with their transaction. This usually starts with “# xyz come to Desk abc” – at this point I’d start the timer. Then, when the customer leaves that desk, I end the time.
  2. Cycle Time: This represents the Service Time in seconds, or the difference between Start Time and End Time.
  3. # of Arrivals: This represents the number of customers who enter the DMV office and begin waiting at the back of the line.
  4. # of Departures: This number represents the number of customers who exit the building after they have been served by the DMV officer.

Notice that I did not time every single transaction – only the ones that I could. So, what is missing here are the simultaneous transactions. Because I only had 1 timer, I could only time 1 transaction at most. That is why there is a difference between # of Arrivals and # of Departures.

After of about 17 minutes of waiting, I finally made it to the point in the line where I could get a number. Below is my Queue number.

dmv practice test

DMV Queueing Results

For the 31 minutes I collected data, below are the key takeaways:

DMV Waiting Line Key Takeaways (31 minutes)

Average Service Time # of Arrivals # of Departures
143 Seconds Per Customer 9 Arrivals 11 Departures

Graphs and Charts

Given the data above, below are a few results of my time at the DMV and the Queueing properties at the Department of Motor Vehicles waiting line:

waiting time at dmv, histogram

This chart tells us the distribution of Service time. Given the 13 observations, it took an average of 143 seconds to serve a customer. Not bad.

waiting line at dmv, run chart

This chart is another picture of service time – this is a run chart perspective.

waiting time, control chart, dmv

Okay, a negative Lower Control Limit (LCL) makes no sense, but that is what the iPhone Cycle Time app gave me. So, I just posted it here for fun. But, in practice – there is no practical or theoretical use for negative LCL.

Now, this chart shows us a Control Chart of the Service Time – not really helpful given the number of observations, but it’s another picture.

All in all, this DMV treated me well and worked very efficiently. The DMV officers worked well and fast and kept up with the length of the Queue by the evidence of customers exiting more than customer were entering. For a busy operation such as the DMV, this is a good property to see, where the exit rate is faster than the enter rate.

The line of customers at the Jacksonville license tag agency was so long Friday that one customer wondered aloud whether prisoners were in a back room making the plates.

Aside from the DMV officers working faster and more effectively, they have also employed a self-service within the building that has helped to increase velocity. Below, you’ll see their use of the Apple iPad in helping customers renew their Driver’s License.

Unfortunately, because I’m new to the state of Tennessee, I wasn’t able to use the Apple iPad to get my license – but I could see that those self-service lines were faster than the DMV officer lines.

ipad-dmv-drivers-license-practice-test

DMV Queueing Properties: Waiting in Line at the Local Department of Motor Vehicles is a post from: Lean Six Sigma Consulting


Defects Hidden in Plain Sight

$
0
0

hidden in plain sight

We have a guest post today from James Lawther. James is primarily involved in process improvement within the Service Industry but, even more than that, he is an articulate thinker and a keen observer of the little things that make such a big difference in business.

As this article will show, you’ll see how a small but subtle difference in thinking can potentially avoid a massive problem – indeed, customer defects – both big and small – are usually hidden in plain sight.

Enjoy the article.


Obviously Wrong

In the mid 1970’s at a military aircraft base in sub Saharan Africa a soldier was on duty.

It was the early hours of the morning.  The sky was cloudless and a full moon illuminated a squadron of brand new MiG-21 fighter planes.  The soldier’s lone figure could be seen patrolling the landing strip, guarding the planes, ensuring they weren’t sabotaged, protecting his country’s military might.

military lean six sigma

The soldier had nobody for company and nothing to do but listen to the sounds of the jungle and wait until the morning.  He was bored out of his mind.

What if you Were Bored?

As he passed one of the planes impulse grabbed him, he jumped up caught hold of the pitot tube on the end of the nose cone and pulled himself up, performing a solitary chin up.

The tube bent.

The soldier tried to straighten it, but despite his best efforts, it was undeniably, unmistakably, horrifically bent.

Now I don’t know this for a fact but I suspect that the soldier was not the brightest man in the army, you don’t put your finest military brains on midnight patrol, but he was sharp enough to realise that somebody was going to spot the damage and, more to the point, he was going to be in a world of misery for some considerable time.

So, quick as a flash he sprinted around the airfield pulling chin ups on the noses of all the other planes, so that they all bent and all looked the same, knowing full well that nobody would ever notice.

The Moral of the Story

My Dad told me the story when I was a boy, I couldn’t vouch for is truthfulness.  No doubt I had just done something similarly stupid, compounding an error, I can’t remember what, but I do remember the story.

Why am I telling it on a process improvement blog?

Simply to reinforce the point that if you want people to realise when something is wrong the best thing you can do is make sure it is obviously wrong.  Change its shape, size, colour or position.  Then it will stick out like a sore thumb (or bent nose).  Otherwise it could be months before anybody notices.

visual management, wrong process


About James Lawther

james lawther service improvementJames has worked for numerous large manufacturing, retail and service companies including Unilever, Mars and Capital One a variety of operational improvement roles. He also ran his own operations improvement consultancy where his clients were as diverse as local and national government, debt collectors and magic circle lawyers.

Visit his web site “The Squawk Point” to find out more about service improvement.

Defects Hidden in Plain Sight is a post from: Lean Six Sigma Consulting

[Fun Friday] Graban is Not Impressed

$
0
0

mckayla maroney is not impressed, gymnast summer olympics

Today, I’m sharing my version of a popular meme on the interwebs – Mark Graban is not Impressed.

Many of you know Mark – he’s a good friend and the writer of Leanblog.org; in his most recent post, he applies some McGyver-like investigation to expose unethical marketing practices by a conference promotion company. Mark was clearly not impressed.

Several of you are familiar with the meme going around of McKayla Maroney, where her unhappy face is superimposed on – literally – everything. Her face shows her being very unhappy to receive the Silver Medal in the 2012 Summer Olympics. Now, I’m not saying she wasn’t happy to get the Silver Medal, but her face is on the web for the entire world to see – and use and superimpose onto everything.

So, today I thought I’d do my version, except with Mark Graban. Now, I’ve known Mark for a long time and he’s a fun and very outspoken guy. And, sometimes, when he’s not impressed, he’ll definitely let you know.

Mark is not Impressed with WCBF

[Fun Friday] Graban is Not Impressed is a post from: Lean Six Sigma Consulting

Customer Service Tips from the DMV

$
0
0

customer service tips, dmv, tennessee

A few weeks ago, I renewed my driver’s license and I documented my Queueing experience of waiting in line at the DMV. There was a sign, hidden behind a desk, that appeared to contain some tips on customer service and it drew my interest. I received wonderful customer service at the Tennessee Department of Motor Vehicles, so I was curious if that excellent service was driven from what was contained in that document. So, I asked the Tennessee DMV if I could have a copy of that document and if I could have their permission to publish it here. They said “Yes”.

The document is divided into two sections:

  1. The first is a promise that the Tennessee DMV makes publicly to its customers.
  2. The second are internal tips that the Tennessee DMV employees are trained on.

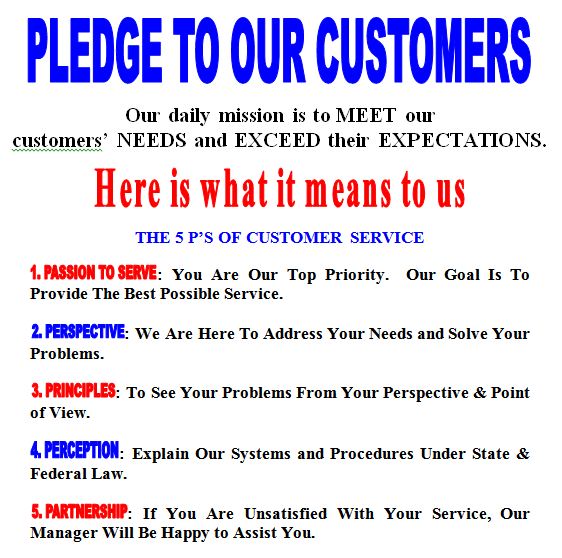
Pledge to Customers

Below is the Tennessee Department of Motor Vehicle’s pledge to its customers:

Our daily mission is to meet our customers’ needs and exceed their expectations.

The 5 P’s of Customer Service

  1. You Are Our Top Priority.  Our Goal Is To Provide The Best Possible Service.
  2. We Are Here To Address Your Needs and Solve Your Problems.
  3. To See Your Problems From Your Perspective & Point of View.
  4. Explain Our Systems and Procedures Under State & Federal Law.
  5. If You Are Unsatisfied With Your Service, Our Manager Will Be Happy to Assist You.

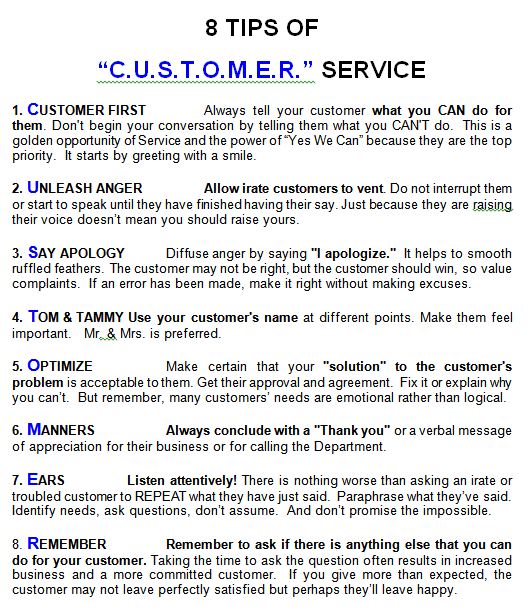
The next section are internal to the Tennessee DMV – material that is used to train employees in how they service customers. After I present their 8 Tips of Customer Service, I want to add a few comments.

8 TIPS OF “C.U.S.T.O.M.E.R.” SERVICE

  1. CUSTOMER FIRST: Always tell your customer what you CAN do for them. Don’t begin your conversation by telling them what you CAN’T do.  This is a golden opportunity of Service and the power of “Yes We Can” because they are the top priority.  It starts by greeting with a smile.
  2. UNLEASH ANGERAllow irate customers to vent. Do not interrupt them or start to speak until they have finished having their say. Just because they are raising their voice doesn’t mean you should raise yours.
  3. SAY APOLOGY: Diffuse anger by saying “I apologize.”  It helps to smooth ruffled feathers.  The customer may not be right, but the customer should win, so value complaints.  If an error has been made, make it right without making excuses.
  4. TOM & TAMMY: Use your customer’s name at different points. Make them feel important.   Mr. & Mrs. is preferred.
  5. OPTIMIZE: Make certain that your “solution” to the customer’s problem is acceptable to them. Get their approval and agreement.  Fix it or explain why you can’t.  But remember, many customers’ needs are emotional rather than logical.
  6. MANNERS: Always conclude with a “Thank you” or a verbal message of appreciation for their business or for calling the Department.
  7. EARS: Listen attentively! There is nothing worse than asking an irate or troubled customer to REPEAT what they have just said.  Paraphrase what they’ve said. Identify needs, ask questions, don’t assume.  And don’t promise the impossible.
  8. REMEMBER. Remember to ask if there is anything else that you can do for your customer. Taking the time to ask the question often results in increased business and a more committed customer.  If you give more than expected, the customer may not leave perfectly satisfied but perhaps they’ll leave happy.

My Comments on Customer Service

First off, thanks to the Tennessee Department of Motor Vehicles for sharing and giving me permission to publish their Customer Service Material.

Here are a few lessons from the DMV customer service tips that other organizations could learn from:

  • We know that when the risk is high, people have more anxiety. This is a lesson we learn from the Psychology of Queueing.
  • Knowing this, it is wise to that items #1 and #2 address this fact – focus on what can be done for the customer (this reassures the customer and reduces anxiety) and also to allow the customer to safely release their anger. The advice and reminder that just because the customer raises his/her voice doesn’t mean we need to raise our voice is also very, very wise. Simple advice – but very effective.
  • Tip #4 – language – the words we say and how we say it – makes a very big difference in diffusing hot situations. Saying the word “I apologize” is simple but very, very effective.
  • Tip #5 is, again, very simple, but often forgotten. Make sure the solution fits the problem.

So, thank you to the Tennessee Department of Motor Vehicles for sharing their Customer Service document with me. I received wonderful service and, what is apparent, is that their customer service declaration and pledge is working because its showing in how their employees are servicing the customer.

customer pledge for customer service

our promise to our customers for service

Customer Service Tips from the DMV is a post from: Lean Six Sigma Consulting

Mobile Survey: Net Promoter Score, Fried, Crispy, or Grilled

$
0
0

online survey design, restaurant loyalty

There’s appears to be a massive proliferation of consumer centered companies interested in obtaining feedback from its customers. Almost where ever I purchase something and receive a receipt, there’s an online or a mobile survey link in the receipt. For this article, I want to share my experience with a mobile survey from Kentucky Fried Chicken.

I’m not sure about you, but I like Kentucky Fried Chicken – KFC. Actually, I’m pretty much a sucker for anything fried, but especially chicken. But, my love with KFC actually started back in High School, where I worked as a cashier at KFC, but then rose up the ladder to become Assistant Manager. At the time, that was a pretty big deal for me, especially since I was only a Junior in High School, working 30 hours per week while maintaining a normal High School curriculum. But, I needed the money and, in retrospect, having that type of business experience early on in my life taught me so much that I still draw from even today.

Back to the mobile survey.

So, after I bought some original flavor Kentucky Fried Chicken, I received a receipt that had a survey invitation. So, while in the car, I decided to take the survey on my iPhone and this is what I was presented with:


mobile survey design

A few observations:

  • KFC chose to use a 7 point likert scale for their NPS Survey.
  • They placed a small space between “Unlikely” and “Likely” to better discriminate between choice options.
  • Because of the mobile aspect, they were sensitive and very wise about making the survey just one question and they made it very easy to complete. I imagine response rates for this survey are very high.

It’s a beautiful design and the mobile aspect is very forward thinking. This survey only had 1 question – yes, it’s the Net Promoter Question. Of, course, I’m a Promoter. The mobile survey software is designed very nicely. Kudos to KFC – great chicken, and great mobile survey design.

Content on this page requires a newer version of Adobe Flash Player.

Get Adobe Flash player

Content on this page requires a newer version of Adobe Flash Player.

Get Adobe Flash player

Mobile Survey: Net Promoter Score, Fried, Crispy, or Grilled is a post from: Lean Six Sigma Consulting

3D Printing: 7 Companies To Watch

$
0
0

3d printing, company directory

As many of you know, shmula.com allows guest bloggers to submit articles in areas of manufacturing, operations research, technology, customer experience, lean manufacturing, leadership, and innovation. In that spirit, we have a guest post today from a 3D Printing expert – an area of intense interest.

Our guest post today is Jeff Dwight, a veteran in the printer manufacturing space. His current interest is in the world of 3D Printing and introduces us to 7 companies we should watch in the 3D Printing Industry.


3D Printing holds the potential to change the entire face of manufacturing. Imagine a freight ship that can leave port loaded with raw material and arrive at its destination with a full cargo of finished parts, or a single 3D printer that can be taken to the moon only to replicate itself 100 times to produce a massive manufacturing infrastructure, and you will have some idea of the vast implications of this exciting new technology. Though still in its infancy, the so-called additive manufacturing industry is already making headway in some astounding new directions. Here’s a look at 7 companies that are using 3D printing technology to accomplish what has never before been possible.

1. Organovo

Founder: Prof. Gabor Forgacs

Organovo specializes in Bioprinting, an innovative new technique of constructing complex organic tissue structures from stem cells with 3D printing technology. They are primarily known for creating the world’s first (and only) bioprinter, the 3D NovoGen MMX, which is in high demand amongst academic and research institutions worldwide.

Only in business since 2009, the company has already been able to produce heart patches, blood vessels, and skin tissue. But Organovo hopes to be able to create entire replacement organs within a few years time. If they succeed, they will not only create a multi-billion dollar industry, they will also change the entire future of medicine and extend countless lives.

3d printing, 7 companies to watch

2. Bespoke Innovations

Founders: Scott Summit and Kenneth Trauner, MD

Bespoke was started in 2010 as an inspiring solution for resolving the discrepancy between mass produced prosthetic limbs and the individual needs of those who receive them. Founded by an industrial designer and orthopedic surgeon, Bespoke designs unique casings for prosthetic limbs that are built to the specifications of the individuals who will wear them and are tailored to satisfy both aesthetic concerns and lifestyle needs.

3D printing allows these “fairings,” as Bespoke calls them, to be affordable, lightweight, and versatile. They are turning prosthesis into artwork, and giving hope and confidence to thousands.

3. Stratasys

Founder: S. Scott Crump

Stratasys is the main force behind 3D printing’s thrust into the industrial manufacturing industry. In 2008, they became the first 3D printing company to attain ISO certification, which is a major step forward for companies specializing in precision manufacturing. Stratasys sells a range of high-end 3D printing machines of various models and sizes throughout the world, has been an industry leader in the development of 3D printing since 1988, and continues to grow. It is also worth mentioning that their stock is currently around $60 per share, and is on the rise.

4. 3D Systems

Founder: Chuck Hull

3D Systems is one of the oldest and most important companies in the additive manufacturing industry. In 1986, they were responsible for the world’s first stereolithography rapid prototyping machine. Since that time, they have continued to extend the capabilities of 3D printing, and now have a whole line of devices available, ranging from personal desktop printers to massive industrial systems.

The company continues to expand, is quite healthy––reporting over $80m in second quarter revenues last year – and is committed to its mission to “democratize access” to 3D printing.

5. MakerBot Industries

Founders: Bre Pettis, Adam Mayer, and Zach Smith

MakerBot, a New York based company founded in 2009, sells a basic 3D Printing machine called a Replicator. Available to ordinary consumers for the relatively inexpensive price of about $2000, it can build thousands of objects, the designs codes for which are catalogued in a constantly expanding open-source online database. When released earlier this year, The Replicator became MakerBot’s third generation 3D printer: the previous two being the Cupcake CNC (2009) and the Thing-O-Matic (2010).

Though MakerBot predominantly markets their machines as educational implements for tech-enthusiastic children, the machines have a wide range of applications and provide a myriad of opportunities for low-cost design and homemade production.

6. Digital Forming

Founder: Assa Ashuach, Dr Siavash Mahdavi, Nicolas de Cordes and Lisa Harouni.

Digital Forming is a business whose main concern is consumer-based innovation. Founded in 2008, they were catapulted to success in 2009 after receiving an Innovation Grant from the UK government. They work closely with outside manufacturers to establish the apparatus necessary for allowing companies to––paradoxically enough––mass-produce products that are individually tailored to each consumer. They make this possible by utilizing the flexibility and versatility of 3D printing, allowing customers in the public sphere to manipulate and customize their items before they are manufactured.

7. Within

Founder: Dr Siavash Mahdavi

Within is a design company specializing in pushing the boundaries of additive layer manufacturing. Their particular focus is on the abilities of 3D printing technology to allow for products that mirror the lattice structures found in biological growth. They can develop objects with variant flexibility, heat conductivity, density, and load-bearing capabilities using a single contiguous material, in the same way that human bones contain these same features––something that is not possible using traditional subtractive manufacturing means. Within has only been in business for six years, but can already boast an incredible array of revolutionary products, which it continues to improve upon.

The possibilities for the future of 3D printing are nearly endless, and as this manufacturing technology continues to become more versatile and efficient, it will entail far-reaching implications for the way things are designed and built in modern societies. These companies, who are amongst the first to explore this technology’s potential, are quite literally reshaping the world one object at a time.


About Jeff Dwight

Jeff Dwight is a print technology expert and writer at PrinterInks; the online shop for ink cartridges by Brother, Dell, Samsung, HP and other leading leading brands.

3D Printing: 7 Companies To Watch is a post from: Lean Six Sigma Consulting

Viewing all 1002 articles
Browse latest View live